Leveraging CDR Indices For Benchmarking Purposes
The Constant Default Rate (CDR), the annualised periodic default rate of a securitisation, is a typical input in ABS cash flow models. Cash flow model users may need a CDR Index to conduct plausibility checks and compare CDR assumptions vs actual observed CDRs.
CDRs ARE AVAILABLE IN ESMA-FORMAT INVESTOR REPORTS
CDRs are provided in the ESMA-format investor report (ESMA Annex 12 under field IVSS27), which can be found using EDW’s EDITOR interface, along with the ESMA Loan-Level Data. Using these ready-made CDRs, it is easy to compute a weighted average CDR index.
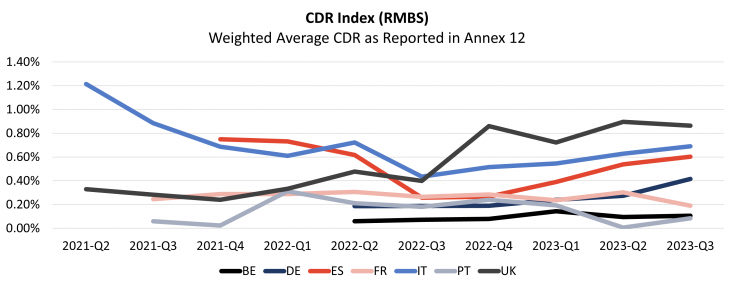
In Exhibit 1 and 2, we show the weighted average CDR indices we calculated for auto ABS and RMBS, using the CDR values as reported in Annex 12. For these charts, we used the CDR data available for a selection of deals that reported plausible CDRs in Annex 12 since 2021 (see methodology below). In Exhibit 1 (Auto), we see an increasing trend in Italy, France, and Portugal. The values observed in the UK and in the Netherlands are substantially lower and do not show the same trend.
Exhibit 1: EDW CDR Index Based on the CDRs as Reported for Auto ABS
Source: European DataWarehouse
The default rates for RMBS (Exhibit 2) are generally lower than for Auto ABS, with some exceptions. In the UK, auto default rates are trending down and at lower levels than RMBS default rates which are trending up instead. Also, we note that the CDRs in Exhibit 2, which are calculated quarterly, appear substantially less volatile than the CDRs in Exhibit 1, which are calculated using monthly data.
Exhibit 2: EDW CDR Index Based on the CDRs as Reported For RMBS

Source: European DataWarehouse
ESMA defines the CDR as reported in Annex 12 as:
The annualised Constant Default Rate (CDR) for the underlying exposures based on the periodic CDR. Periodic CDR is equal to the [(total current balance of underlying exposures classified as defaulted during the period) / (total current balance of non-defaulted underlying exposures at the beginning of the period)]. This value is then annualised as follows:
100*(1-((1-Periodic CDR)^number of collection periods in a year))
“Periodic CDR” refers to the CDR during the last collection period, i.e. for a securitisation with quarterly paying bonds this will usually be the prior three month period.
(Source: ESMA Technical Standards on Disclosure Requirements)
MAKING A CDR INDEX FROM COMPARABLE DEALS OF THE SAME SERIES IS MORE USEFUL
In order to compare like and like, in Exhibit 3, we show the German Auto CDR index alongside three of its components made from several comparable securitisations. We find that the indices for the Bavarian Sky series (BMW) and Silver Arrow (Mercedes) tend to be at similar levels and even seem to be strongly correlated. The CDR indices for the VCL series are well below the two others and the German Auto Index; this is likely due to the way defaults are defined in the VCL series.
Exhibit 3: Aggregating The Data for Specific ABS Series
Source: European DataWarehouse
Differences in CDR levels across countries and asset classes can partially be explained by differences in default definitions and loan management practices:
- Default definitions can differ across asset classes (shorter for auto, longer for mortgages) and countries, and can go from 90 days to 12 or 18 months as is the case in some Spanish RMBS securitisations.
- Some originators restructure or repurchase loans before they default, which can lead to lower observed CDR levels.
METHODOLOGY
To compose our weighted average CDR indices, we started checking the CDR values reported using the following criteria:
- When we see CDR values that only ever increase from very low values to relatively high values, we excluded these values assuming the data provider reported a cumulative default rather than a CDR (we are currently investigating these cases).
- We only included in our calculations the CDRs that were provided in securitisations for which defaulted amounts were reported. If there is a CDR, there should be outstanding defaults, if there are outstanding defaults, there should be a CDR.
- For Auto, we used CDRs for which there is monthly reporting (thus excluding those reported quarterly), for RMBS, we used CDRs reported quarterly only (thus excluding CDRs reported monthly). Please note that for a same deal, a CDR calculated monthly will be more volatile than a CDR calculated quarterly.
- Lastly, we treated CDRs of 0% with caution (hence no index for the Dutch RMBS segment); when no CDR is reported, it can be because a securitisation is too recent for defaults to have had time to materialise, given the default definition (we do not expect to see many defaults in the first 11 months of a securitisation with a 12 months default definition).
Due to the above criteria, for this study, we used CDRs from 166 deals out of 308 auto and RMBS deals for which Annex 12 is available.
The first step for anyone wanting to leverage CDRs for benchmarking, research or due diligence purposes is to access the data using European DataWarehouse’s EDITOR Platform.
CDRs can be found in the Annex 12 as uploaded to EDITOR. Alternatively, you can download them for several deals for several periods from our database. We provided further details on our CDR calculations in our spring research webinar, click here to view the event content. Please do not hesitate to contact us if you need a custom-made CDR index at enquiries@eurodw.co.uk.